
Benefits of Diversified Carbon Portfolios
By Oktay Kurbanov, Partner at Climate Finance Partners (CLIFI)
Introduction
Over the last few years, exposure to carbon as an asset class has become a common component in investor portfolios. This trend was supported in part by carbon allowances' strong performance over the last few years, where the IHS Global Carbon Index experienced a 34% annualized return from January 2021 to July 2023 [1]. It is also related to investors' desire to participate in climate action as the price of carbon needs to increase significantly to incentivize energy transition and abatement technologies. Investors thinking of adding carbon exposure to their portfolios will inevitably have to decide how to allocate that exposure across regional carbon allowance markets. This paper discusses investment considerations that should go into this decision, focusing on the pitfalls of concentrated portfolios and the benefits of diversification. Using two major cap-and-trade markets, European Union carbon allowances (EUAs) and California carbon allowances (CCAs), it illustrates the following points:
High concentrations in CCAs lie below the efficient frontier
EUA-concentrated portfolios can significantly reduce risk by diversifying into CCAs
Diversified portfolio of compliance carbon programs offers optimal risk/return
The discussion will start with a description of opportunities in each of these markets, followed by the analysis and discussion of risk and return characteristics of concentrated vs. diversified portfolios.
European Union ETS
The EU ETS is the most liquid carbon allowance futures market. This market has experienced total notional trading volumes of about $630 billion in 2022 and has grown exponentially in recent years, increasing by more than four times since 2018 [2]. As shown in Figure 1 below, the price of EU ETS carbon allowances has increased dramatically since 2019, which has amplified the program's recognition among media outlets and commodity investors.
Figure 1: European Union ETS Futures Price
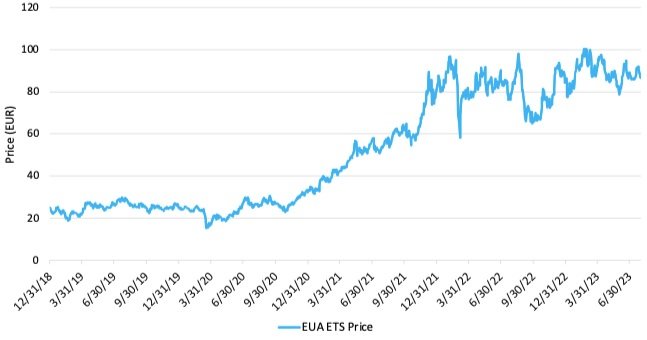
Sources: ICE exchange, July 2023
A notable feature of the EU ETS is the Market Stability Reserve (MSR) mechanism that removes 24% of excess allowances from the auctions if the total number of allowances in circulation (currently 1.4 billion metric tons [Mt]) is higher than a predetermined threshold (833 Mt). The MSR provides a strong price support mechanism, which helped prices rally from 2019 onward. In December 2022, the European Union finalized a set of sweeping reforms ("Fit for 55") to align the EU ETS with the goal of reducing the European Union's emissions by 55% vs. 1990 levels. The reforms include reducing the annual supply of auctioned allowances by one-off reductions of 90Mt in 2024, 27Mt in 2026, accelerating the annual cap reduction schedule, and targeting a decrease of 62% of the annual emission cap in 2030 vs. 2005 (the first year of the ETS). The stricter emissions reduction targets will drive a shortage of allowances in the market, potentially driving up the price and making carbon emissions more expensive.
California Cap-and-Trade Program
California has always been at the forefront of climate policy. State goals have historically been higher than US Federal regulations for clean air, clean fuels, and environmental protection. Established in 2013, the California Cap-and-Trade Program is a key element of the state's climate plan, developed under the framework of the California Global Warming Solutions Act of 2006 (Assembly Bill 32). In December 2022, California's legislature agreed to increase the state's ambition to achieve emission reductions of 48% in 2030 vs. 1990 levels, upward from the previously mandated goal of 40%. Cap-and-trade is a key policy tool to achieve this ambition, and this year, legislators are working to introduce more stringency in the program to achieve climate goals, including tightening the caps, increasing the price containment and ceiling levels, and measures to reduce excess allowances in circulation. The CCA prices reacted positively as CARB considered a scenario of an even more ambitious emissions reduction of 55% by the year 2030, delivering 24% performance in 2023 through the end of July [3]. Going forward, these measures will provide steady support for CCA prices.
The ICE CCA futures market saw trading volumes of ~44.5 billion in 2022. Market liquidity has improved dramatically since 2019 as market makers and hedge funds have moved into the market, signaling an increasing interest in carbon as an asset class. As seen in Figure 2, CCA futures prices have increased over the recent period, with the bulk of the gains concentrated in 2021, when increased financial participation turned the overall market sentiment bullish.
Figure 2: California Cap-and-Trade (CAT) Future Price

Sources: ICE Exchange, July 2023
As new stringency measures are expected to become effective in 2025, many investors are positioning themselves long in anticipation of increasing demand for California allowances, which will create a favorable climate for future price appreciation in the Cap-and-Trade program.
Diversification Discussion
Empirical Evidence
The diversification arguments that use historical returns of carbon allowances can be dominated by the stellar performance of EUAs, as EUA prices more than tripled from an average of 25EUR in 2019 to an average of 81EUR in 2022 [4]. IHS Markit Carbon EUA Index, an investable index designed to measure the performance of the EU ETS carbon allowance market (referred to below as "EUAs"), returned 35.4% annualized return from August 2014 through July 2023. Over the same period, IHS Markit Carbon CCA Index, designed to track the performance of California's carbon allowance market (referred to below as "CCAs"), returned 10.3% annualized return, a solid performance, but a third of the European carbon allowance market [5]. However, the returns are only one side of the coin. EUAs strong performance over the years came with high volatility risk. Compared to CCAs, EUAs realized three times higher volatility of 43%with a worst 12-month return of negative 47% during the period (Nov 2016) versus a more tolerable volatility of 14% for CCAs, with a worst 12-month return of negative 19% (Nov 2022). Table 1 below presents these statistics for a 100% CCA portfolio (top row) and a 100% EUA portfolio (bottom row), as well as various CCA/EUA portfolio mixes in between. The color-coding in the table highlights very concentrated portfolios (yellow) and more diversified portfolios (green), with somewhat concentrated portfolios left unhighlighted. The boundaries of what defines concentrated and what defines diversified portfolios are subjective and chosen for illustrative purposes only to facilitate the analysis.
Table 1: Historical performance of portfolios as a function of % weight of CCAs and EUAs, Aug 2014 - Jul 2023

Source: S&P Global/IHS Markit
Looking at Table 1 results, one can draw the following conclusions by comparing concentrated areas to more diversified portfolios:
CCA-concentrated portfolios (in the top yellow-highlighted section) have delivered inferior returns versus diversified portfolios. Adding about a third of EUA exposure (35%, the top line of the green section), a modest amount of diversification, almost doubles the annualized return to 19.1% versus 10.3% in a CCA-only portfolio. Meanwhile, the volatility increases by less than a third, from 14% to 18% per annum, while the worst 12-month return slightly decreases. This addition also produces a superior risk/reward ratio of 1.03, a 40% improvement from the concentrated case;
EUA-concentrated portfolios (in the bottom yellow-highlighted section) have delivered strong returns, albeit with much higher volatility versus more diversified portfolios. Adding about a third of CCA exposure (35%, the bottom line of the green section) decreases volatility risk by a third versus an EUA-only portfolio, from 43% to a much lower level of 29%. To achieve this risk reduction, one would have to give up some of the returns, which would decrease from 35.4% to a still attractive level of 26.4%. The risk/reward ratio improves by about 11%.
Regardless of which portfolio is chosen in the diversification area, it delivers superior risk/reward ratios versus concentrated regions while offering an attractive level of returns.
Forward-looking Analysis
To complement the historical analysis, in this section, we take a more forward-looking approach. For this purpose, we believe more recent data from Jan 2021 - July 2023 is well suited to form our forecasts for expected returns and volatilities of CCAs and EUAs, as well as their correlation. For the forecast of expected returns, we apply discounting to the recent outsized great performance. While we are optimistic about carbon markets going forward, we apply 50% discounting to both CCAs and EUAs to bring returns to more modest expectations, perhaps on the conservative side, as seen in Table 2:
Table 2: Expected Risk and Return (annualized)

Source: S&P Global/IHS Markit carbon indices, CLIFI
Table 3 below uses the above forward-looking estimates to build hypothetical expected returns and volatilities for various portfolio mixes of CCA and EUA:
Table 3: Hypothetical expected return and volatility of portfolios as a function of % weight of CCAs and EUAs

Sources: S&P Global/IHS Markit carbon indices, CLIFI
Observing forecasted statistics in Table 2 and contrasting concentrated (yellow highlights) and diversified portfolios (green highlights) in Table 3, one draws a couple of important conclusions:
First, the volatility forecast for CCAs, 26%, is much higher than the long-term realized volatility, 14%. The expected EUA volatility, on the other hand, is very close to its long-term value. This makes an even stronger argument for the benefits of adding some EUAs to CCA-only portfolios. For example, shifting a third of the CCA-only portfolio (the top line of Table 3) toward EUAs (the top line of the green section in Table 3) increases the expected return from 13% to 15%, while keeping volatility at nearly the same level of around 26%.
Another interesting observation is that CCAs have a better forecasted risk/reward ratio than EUAs (Table 2), while in the historical sample, it was the opposite. This brings even more benefits to those who want to shift some weight from a EUA-only portfolio to CCAs to meaningfully decrease risk, as this shift will decrease a lot more volatility per unit of expected return given up versus what one may infer using the historical sample. For example, shifting a third of an EUA-only portfolio (the bottom line of Table 3) to CCAs (the bottom line in the green section in Table 3) decreases volatility from 46% to 34% (more than a quarter decrease) while the expected return decreases by only about 2%, from 19.6% to 17.3%. The risk/reward ratio would improve by a significant 20%.
Efficient Frontier
To visualize the diversification discussion in the section above, we can look at the efficient frontier for fully invested portfolios with two assets, CCAs and EUAs. Figure 3 below presents an efficient frontier based on the expected returns and risk data in Table 3.
Table 3: Efficient Frontier of Portfolios with CCAs and EUAs

Source: S&P GLobal/IHS Markit carbon indices, CLIFI
The efficient frontier graph helps visualize two important diversification points:
Portfolios that are concentrated in CCAs are inefficient portfolios. One can move upwards toward the efficient frontier points that have 25-35% of EUA exposure and obtain a higher expected return while maintaining a similar or even slightly lower volatility risk.
One can also see how far on the right of the volatility risk axis are the EUA concentrated portfolios versus more diversified portfolios. Moving to the left toward the 35% CCA / 65% EUA mix will lead to a significant drop in volatility by more than a quarter vs. the EUA-concentrated portfolio, while keeping the return in high teens.
Conclusion
We have demonstrated the benefits of diversified portfolios versus concentrated ones. Diversified portfolios offer a better risk/return profile, ensure greater portfolio efficiency, and help manage downside risk while offering attractive returns. This is consistent with commonly held wisdom; however, based on our forecasts, these diversification benefits are very compelling for carbon markets going forward.
The optimal portfolio blend for each investor will depend on many factors, such as risk tolerance, home bias, implementation constraints, and other considerations that factor into allocation decisions. While there are numerous combinations, we have shown that there is a strong case to build a diversified portfolio when investing in carbon markets.
As investors in carbon markets assess economic and geopolitical uncertainties and other factors beyond their control, they can take advantage of what they can fully control, famously called by Harry Markowitz "the only free lunch in investing": building a robust blended portfolio of compliance carbon programs to take advantage of the benefits discussed in this paper.
[1] Source: SP Global / IHS Global Carbon Index, July 2023
[2] Source: ICE
[3] Source: ICE
[4] Source: ICE
[5] Source: SP Global
Important Notes:
Carefully consider the Funds’ investment objectives, risk factors, charges and expenses before investing. This and additional information can be found in the Funds' full and summary prospectus, which may be obtained by visiting www.kraneshares.com/krbn, www.kraneshares.com/kcca, and www.kraneshares.com/keua. Read the prospectus carefully before investing.
Risk Disclosures:
Investing involves risk, including possible loss of principal. There can be no assurance that a Fund will achieve its stated objectives. Indices are unmanaged and do not include the effect of fees. One cannot invest directly in an index.
This information should not be relied upon as research, investment advice, or a recommendation regarding any products, strategies, or any security in particular. This material is strictly for illustrative, educational, or informational purposes and is subject to change. Certain content represents an assessment of the market environment at a specific time and is not intended to be a forecast of future events or a guarantee of future results; material is as of the dates noted and is subject to change without notice.
The Funds rely on the existence of cap and trade regimes. There is no assurance that cap and trade regimes will continue to exist, or that they will prove to be an effective method of reduction in GHG emissions. Changes in U.S. law and related regulations may impact the way the Funds operate, increase Fund costs and/or change the competitive landscape. New technologies may arise that may diminish or eliminate the need for cap and trade markets. Ultimately, the cost of emissions credits is determined by the cost of actually reducing emissions levels. If the price of credits becomes too high, it will be more economical for companies to develop or invest in green technologies, thereby suppressing the demand for credits. The Funds may invest in derivatives, which are often more volatile than other investments and may magnify the Funds' gains or losses. A derivative (i.e., futures/forward contracts, swaps, and options) is a contract that derives its value from the performance of an underlying asset. The primary risk of derivatives is that changes in the asset's market value and the derivative may not be proportionate, and some derivatives can have the potential for unlimited losses. Derivatives are also subject to liquidity and counterparty risk. The Funds are subject to liquidity risk, meaning that certain investments may become difficult to purchase or sell at a reasonable time and price. If a transaction for these securities is large, it may not be possible to initiate which may cause the Funds to suffer losses. Counterparty risk is the risk of loss in the event that the counterparty to an agreement fails to make required payments or otherwise comply with the terms of derivative.
The use of futures contracts is subject to special risk considerations. The primary risks associated with the use of futures contracts include: (a) an imperfect correlation between the change in market value of the reference asset and the price of the futures contract; (b) possible lack of a liquid secondary market for a futures contract and the resulting inability to close a futures contract when desired; (c) losses caused by unanticipated market movements, which are potentially unlimited; (d) the inability to predict correctly the direction of market prices, interest rates, currency exchange rates and other economic factors; and (e) if the Fund has insufficient cash, it may have to sell securities or financial instruments from its portfolio to meet daily variation margin requirements, which may lead to the Fund selling securities or financial instruments at a loss. The Funds invest through a subsidiary, and is indirectly exposed to the risks associated with the Subsidiary's investments. Since the Subsidiary is organized under the law of the Cayman Islands and is not registered with the SEC under the Investment Company Act of 1940, as such the Funds will not receive all of the protections offered to shareholders of registered investment companies. The Funds and their Subsidiary will be considered commodity pools upon commencement of operations, and each will be subject to regulation under the Commodity Exchange Act and CFTC rules. Commodity pools are subject to additional laws, regulations and enforcement policies, which may increase compliance costs and may affect the operations and performance of the Funds and the Subsidiary. Futures and other contracts may have to be liquidated at disadvantageous times or prices to prevent the Funds from exceeding any applicable position limits established by the CFTC. The value of a commodity-linked derivative investment typically is based upon the price movements of a physical commodity and may be affected by changes in overall market movements, volatility of the Index, changes in interest rates, or factors affecting a particular industry or commodity.
Fluctuations in currency of foreign countries may have an adverse effect to domestic currency values. The Funds are subject to interest rate risk, which is the chance that bonds will decline in value as interest rates rise. Narrowly focused investments typically exhibit higher volatility. The Funds’ assets are expected to be concentrated in a sector, industry, market, or group of concentrations to the extent that the Underlying Index has such concentrations. The securities or futures in that concentration could react similarly to market developments. Thus, The Funds are subject to loss due to adverse occurrences that affect that concentration. The Funds are non-diversified.
KRBN, KEUA, and KCCA may underperform other similar funds that do not consider conscious company/ESG guidelines when making investment decisions.
ETF shares are bought and sold on an exchange at market price (not NAV) and are not individually redeemed from the Fund. However, shares may be redeemed at NAV directly by certain authorized broker-dealers (Authorized Participants) in very large creation/redemption units. The returns shown do not represent the returns you would receive if you traded shares at other times. Shares may trade at a premium or discount to their NAV in the secondary market. Brokerage commissions will reduce returns. Beginning 12/23/2020, market price returns are based on the official closing price of an ETF share or, if the official closing price isn't available, the midpoint between the national best bid and national best offer ("NBBO") as of the time the ETF calculates the current NAV per share. Prior to that date, market price returns were based on the midpoint between the Bid and Ask price. NAVs are calculated using prices as of 4:00 PM Eastern Time.
The KraneShares ETFs and KFA Funds ETFs are distributed by SEI Investments Distribution Company (SIDCO), 1 Freedom Valley Drive, Oaks, PA 19456, which is not affiliated with Krane Funds Advisors, LLC, the Investment Adviser for the Funds, or Climate Finance Partners , the Sub-Advisor for the Fund, or IHS Markit Ltd.
[R_US_KS_SEI]